Tuesday, November 15, 2011
Tuesday, April 12, 2011
Global Warming and Its Impact in Nepal
2010 has been reported as the warmest year in the history. According to the analysis of NASA’s Goddard Institute for space studies (GISS) in New York, global surface temperature in 2010 was 0.74oC warmer than the average global surface temperature from 1951 to 1980 (which is considered as a standard global temperature for climate change study). Similarly, the temperature recorded is 0.62oC above than 20th century average global temperature. GISS says that the warmest years since record keeping begun in 1880 are 2005 and 2010 (tied) followed by 1998, 2002,2003,2006,2007 and 2009.
The year 1934 was a very hot year in United States, in the third position after 2005/2010 and 1998. Therefore climate change skeptics said that recent hot years are not unusual. However, we cannot ignore the fact that ten consecutive hottest years since 1880 in the global history are after 1998. The analysis done by GISS is based on the weather data from more than 1000 meteorological stations all around the world and satellite observed data for sea surface and arctic region.
 While talking about the Himalayas, warming trend has been recorded much greater than the global average. According to the reports from ICIMOD the temperature increasing rate in Nepal is 0.6oC per decade which is quite higher than that of the global average of 0.74oC (0.074 oC per decade) over last one hundred years. This result is very close to the results obtained from some other individual research.
 The global warming has the multidimensional adverse effect in the earth environment and the living beings. Greater uncertainty in the rainfall and the flood in Pakistan last year are some of the recent examples. Similarly, we have been fighting with the winter drought in last couple of years. Several reports have been published in the media about the starvation in 2008/2009 in far and mid western region of Nepal, which is also the impact of climate change. Furthermore, unseasonal and untimely blooming of rhododendron in our forest is also the live example which shows the impact of climate change in our ecology.
As the altitude increased, adverse impact of global warming is also increased. Therefore, the Himalayas is one of the most vulnerable region in the world. The warming has impacted in the glacial ecosystem tremendously. Several researches revealed that about sixty seven percent of glaciers are retreating in the Himalayas and climate change has been identified as the major factor in it. Various researchers claim different altitudes of snow lines (altitude above which there is snow all the time) ranging from 5200 m to 6000 m, but my own research shows that currently it is 5400 m which was 4700 m until late 90’s. The snow melting does not have a single effect; it has significant effects on the late spring and summer runoff in the Nepalese rivers. This will have dramatic adverse effects on biodiversity and habitants for stream biota and livelihood in lower catchment.
The global warming seems inevitable fact/event, and nobody can mitigate or control the warming trend and its adverse effect. Therefore, many countries in the world have already implemented their strategy to adopt in the changing environment rather than mitigation. We also have to go to implement the adaptation strategy without any delay if we want our existence in the world.
While developing the climate change strategies, we have to focus in mitigation of the negative impacts on human societies, reduce their vulnerability in different aspects of human life like agriculture, water resources or other natural resources which have more impact in our socioeconomic aspects. The activities may include the crop translocation or reschedule the crop plantation. Planned and effective uses of water or construction of the big reservoirs in the Himalayas region to store the monsoon water and uses in the rest of the time in the year for multiple purpose. Therefore, it would be better, if the national planning commission keep in mind about the adaptation strategy while developing infrastructures.
Mr. Bhogendra MishraTuesday, November 30, 2010
New Google Earth 6
Google has just introduced the newest version of Google Earth, Google Earth 6.
This latest incarnation follows last June's Google Earth 5.2 and adds three major updates to the virtual geographical tool: integrated Street View, 3D trees, and an improved historical imagery system.
While Street View was first introduced in 2008, the newest version integrates the up-close, photographic imagery of the original with the maps, satellite images and computerized renderings that characterize the birds-eye view. Though toggling between the different perspectives used to be more unwieldy, 6.0 allows the user to see when Street View is available by highlighting roads blue when the Pegman icon is dragged over the image. Apart from the new method of entering Street View, the Street View layer itself has been streamlined to allow easier navigation around the layer with mouse or arrow keys.
Earlier versions of Google Earth already rendered buildings in 3D, but 6.0 also adds 3D trees to the landscape. Not content to populate the virtual globe with the generic lollipop variety, Google Earth 6.0 actually includes highly detailed models for dozens of species of trees. They've already 'planted' 80 million trees in Athens, Berlin, Chicago, New York City, San Francisco and Tokyo. Apart from helping the simulation's realism, Google is also working to model endangered forests in places like Brazil and Africa as a part of their Google Earth Outreach program.
The update to the historical imagery tool in Google Earth is minor, but helps draw attention to one of the program's most interesting features. Google Earth already had satellite and aerial imagery documenting recent disasters like the 2010 Haiti Earthquake before and after, as well as visions of London in 1945 and Warsaw in 1935, but the update makes it much easier to use the feature. Now, anytime a user is in an area where historical imagery is available, a pop-up appears in the bottom of the screen displaying the oldest possible date for the location.
For detail information
Saturday, November 27, 2010
Two new Earth observation missions chosen for further study
As part of the procedure to realize European Space Agency’s (ESA) series of Earth Explorers, two new mission proposalshave been selected for further development. The missions, called FLEX and CarbonSat, now vying to be the eighth Earth Explorer, both address key climate and environmental change issues.
The selection follows ESA's Call for Earth Explorer Proposals that was released in October last year and ended in the Agency receiving 31 high-quality mission concepts. Subsequently, the proposals were carefully evaluated by leading Earth scientists in four peer review panels.
This evaluation process resulted in ESA's Earth Science Advisory Committee selecting two missions considered the most scientifically relevant, recommending that the Florescence Explorer (FLEX) and CarbonSat be presented to ESA's Programme Board for Earth Observation.
The CarbonSat mission would quantify and monitor the distribution of two most important greenhouse gases in the atmosphere, also released through human activity: carbon dioxide and methane. Data from the mission would lead to a better understanding of the sources and sinks of these two gases and how they are linked to climate change.
The FLEX mission aims to provide global maps of vegetation fluorescence, which can be converted into an indicator of photosynthetic activity. The data would improve our understanding of how much carbon is stored in plants and their role in the carbon and water cycles.
The mission would work in combination with the Ocean and Land Colour Instrument and the Sea and Land Surface Temperature Radiometer on Sentinel-3 to improve models of future atmospheric carbon dioxide concentrations.
The next step in the development of these two mission concepts is to begin the definition studies in the second quarter of 2011.
There are three Earth Explorers in orbit: GOCE, SMOS and CryoSat; a further three being constructed: Swarm, ADM-Aeolus and EarthCARE; and three undergoing feasibility studies competing for selection as Earth Explorer-7: BIOMASS, PREMIER and CoReH2O.
![]()
The selection follows ESA's Call for Earth Explorer Proposals that was released in October last year and ended in the Agency receiving 31 high-quality mission concepts. Subsequently, the proposals were carefully evaluated by leading Earth scientists in four peer review panels.
This evaluation process resulted in ESA's Earth Science Advisory Committee selecting two missions considered the most scientifically relevant, recommending that the Florescence Explorer (FLEX) and CarbonSat be presented to ESA's Programme Board for Earth Observation.
The CarbonSat mission would quantify and monitor the distribution of two most important greenhouse gases in the atmosphere, also released through human activity: carbon dioxide and methane. Data from the mission would lead to a better understanding of the sources and sinks of these two gases and how they are linked to climate change.
The FLEX mission aims to provide global maps of vegetation fluorescence, which can be converted into an indicator of photosynthetic activity. The data would improve our understanding of how much carbon is stored in plants and their role in the carbon and water cycles.
The mission would work in combination with the Ocean and Land Colour Instrument and the Sea and Land Surface Temperature Radiometer on Sentinel-3 to improve models of future atmospheric carbon dioxide concentrations.
The next step in the development of these two mission concepts is to begin the definition studies in the second quarter of 2011.
There are three Earth Explorers in orbit: GOCE, SMOS and CryoSat; a further three being constructed: Swarm, ADM-Aeolus and EarthCARE; and three undergoing feasibility studies competing for selection as Earth Explorer-7: BIOMASS, PREMIER and CoReH2O.
For further please visit: http://www.educationgis.com/2010/11/two-new-earth-observation-missions.html
Thursday, November 25, 2010
Size and Health of the UK Space Industry Report
The British space industry has grown by nearly eight per cent through the recession and is now worth over GBP7.5 billion, according to UK Space Agency report.
The report, ‘The Size and Health of the UK Space Industry,’ is the latest update of a biennial survey of British companies involved in the sector. It shows that space industry has grown by more than 10 per cent on an average over the last two years.
The report, produced for the UK Space Agency by Oxford Economics, surveyed 260 companies across both the upstream (companies which provide space technology) and the downstream (companies that utilise space technologies). Against the backdrop of difficult economic conditions, the space industry has maintained its momentum, as it recorded an average growth of more than 11 per cent in downstream companies and three per cent growth in upstream providers, compared to the national GDP growth of 0.3 per cent, according to UK Space Agency.
Science Minister David Willetts said, “The British space industry is worth over GBP7 billion to the economy. It is a sector that is growing as fast as the Chinese economy and a remarkable success story of high-tech innovation.”
Employment within the space sector has also strengthened by just over nine per cent to reach 24,900 in 2008/2009. Upstream and downstream industries have both grown at a rate of over 12 per cent, doubling the average annual employment growth rate of six per cent since 1999/2000.
Thursday, November 11, 2010
ESRI Canada Brings Interactive Maps to BlackBerry Smartphones with Freeance Mobile
ESRI Canada today announced that the company has signed an agreement to become the exclusive Canadian distributor of TDC Group's Freeance Mobile for BlackBerry. The solution helps organizations maximize their investment in ESRI's geographic information system (GIS) technology by pushing out GIS data and applications to field workers using BlackBerry smartphones. Users can search, view and edit data and maps stored in their enterprise GIS while on the move, reducing costs and increasing productivity and efficiency.
“The ubiquity of BlackBerry smartphones makes them ideal devices for extending enterprise GIS to the field,” said Alex Miller, president, ESRI Canada. “With Freeance, remote workers in every industry can easily access valuable corporate geographic information needed to make decisions on the go. The ability to edit data in the field also ensures that there are no information gaps and that the data in their GIS is always up to date.”
Communicate GIS Data in Real Time To and From the Field
Freeance allows organizations using ESRI's ArcGIS Server technology to securely deliver maps and location-based data live to an unlimited number of BlackBerry smartphone users within the organization's network. Field workers can capture and publish data and imagery without returning to the office to upload the information to the GIS, resulting in significant time and cost savings. The solution also enables real-time tracking of personnel and assets, helping to ensure the safety of mobile staff and the effective deployment of resources. Freeance is designed for organizations with a dispersed mobile workforce, including utilities, energy, business, public safety, public works and government organizations. It enhances operations including customer service, emergency management, infrastructure management, work order management, network planning, property assessment, asset inventory and inspection.
Nova Scotia Power Inc. (NSPI) in Atlantic Canada has deployed Freeance to enhance its electrical distribution system model, which will help enhance service reliability for its nearly half a million customers. They use the solution to collect data about individual components of their distribution system including transformers and disconnect switches, as well as the components' precise location. Data entered through Freeance is automatically transferred to their ArcGIS Server, and used by technicians to update the electrical model. With a more accurate picture of their distribution system, NSPI is able to better predict and resolve outages. “Freeance on BlackBerry allowed us to avoid the need for collectors to travel to local utility depots for data uploads each day. Two hours saved per day for each of the 14 collectors translates into nearly $200,000 worth of labor savings,” said Brian Shannon, GIS Connectivity Project Manager, NSPI.
Licensing and Availability
Freeance is a commercial off-the-shelf software that runs as a server-based solution. It integrates with ArcGIS Server and other enterprise systems, and can be deployed in as quickly as a few hours. It is offered in three editions: Freeance Pro, which can be used to build an unlimited number of GIS applications and includes editing capabilities; Freeance Basic, which allows the creation of up to two map applications; and Freeance View – available at no cost, this software allows you to publish and view ArcGIS maps on your BlackBerry. The solution runs on all versions of BlackBerry smartphones with BlackBerry OS version 4.5 or higher.
To download the free edition and obtain more information on Freeance, visit: esricanada.com/products/freeance
About TDC Group, Inc.
TDC Group, Inc. (TDC) is a pioneer developer of cost-saving mobile location solutions that accelerate workflow and enhance productivity for the enterprise market. Freeance Mobile software brings enterprise GIS to BlackBerry smartphones by way of intuitive applications that feature interactive maps, database forms and searching, tracking and geo-tagged digital photos. Customers can easily build mobile applications that extend rich enterprise data and resources to users wherever and whenever they need it. Government, utilities and corporations of all sizes use Freeance Mobile to complete work faster, save money and increase service responsiveness. For more information, visit www.freeance.com.
About ESRI Canada
Founded in 1984, ESRI Canada provides enterprise geographic information systems (GIS) solutions that empower businesses, governments and educational institutions to make timely, informed and mission-critical decisions by leveraging the power of geography. The company distributes the world's leading GIS software from ESRI, Telvent, Azteca Systems and other technology partners. Headquartered in Toronto, the company serves over 10,000 customers from 16 regional offices across Canada and has been named as one of the top 250 Canadian IT companies and top 25 IT professional services providers in Canada by the Branham Group. Information about ESRI Canada can be found at esricanada.com.
Source: http://spatialnews.geocomm.com/dailynews/2010/nov/11/news4.html
Europian Union's Environmental Map Services Move to Cloud
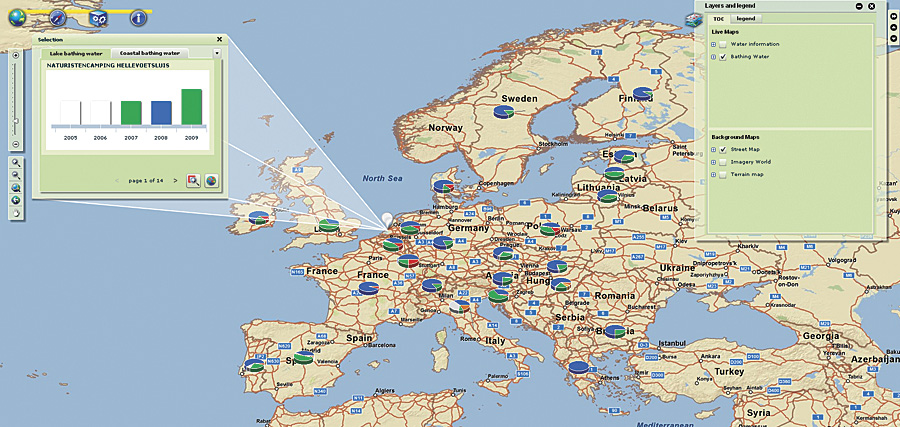
Through EEA, the quality of bathing water can be assessed across Europe for quick understanding of information and trends in each country and across time.
The European Union's (EU) European Environment Agency (EEA) is working closely with Esri to improve the agency's cloud environment map services. EEA and Esri have signed a memorandum of understanding that allows EEA to expand deployment of ArcGIS 10 and better fulfill its project goals. European countries will be able to share environmental data more easily, and agencies, scientists, and policy makers will have quick access to data for viewing and analysis in GIS.
EEA helps EU and its member countries make informed decisions about improving the environment, integrating environmental consideration into economic policies, and moving toward sustainability. It also coordinates the European Environment Information and Observation Network (Eionet). Esri's complete integrated software system ArcGIS 10 plays a prominent role in helping EEA achieve its goal of delivering geographic visualization and analysis capabilities to environmental data consumers.
"We were very pleased to sign a new agreement with Esri for use of its ArcGIS 10 software," says EEA executive director Jacqueline McGlade. "This relationship will enable the 450 institutions participating in Eionet to access the software and will allow us to develop technologies, such as mobile GIS, within our community."
EEA collaborates with its member countries in the European Commission's Shared Environmental Information System (SEIS) initiative. The initiative aims to improve data availability and quality, streamline data handling, modernize reporting, and foster the development of information services and Web-based applications. Many countries have started to apply the principles of SEIS, which are based on distributed information management. Several European initiatives are providing the building blocks for SEIS, including
- Infrastructure for Spatial Information in Europe (INSPIRE)—A European Union directive to create a spatial data infrastructure that enables sharing geospatial data among European public-sector organizations and with the public
- Global Monitoring for Environment and Security (GMES)—A collaboration between the European Commission and the European Space Agency for the establishment of a European capacity for earth observation from space and in situ that supports sustainable development and global governance
- Water Information System for Europe (WISE)—EEA and European Commission's Internet tool that informs citizens about water quality and EU water policy
- Ozone Web—EEA portal for near real-time ozone information
- Eye on Earth—EEA's two-way communication platform, which brings together scientific information with feedback and observations of millions of ordinary people via social networking sites
- Biodiversity Information System for Europe (BISE)—A Web portal for data and information on biodiversity in the European Union
EEA executive director Jacqueline McGlade.
These services are transitioning to cloud computing, wherein technological capabilities are commonly maintained off premises and delivered on demand as services via the Internet. An advocate of cloud computing, McGlade notes, "Our community has a great appetite for all kinds of applications, and we can move these in and out of the cloud as needed. Every time we add a new service that has a transaction element, we see the access numbers go up and up. We have to accommodate the fact that the more information we put out there, the more people want to look at it. We anticipate that people want to do their own start-ups and their own applications out of the reference data that we are creating."
Cloud GIS offers data storage, end-user Web applications, and focused computing services. It costs less, is always available, has faster application delivery, is flexible, and has improved business continuity. Most importantly, it enables collaboration and community computing for easier and faster information sharing.
"Costs of this type of service are falling and tumbling," continues McGlade. "As far as cost, EEA is looking at a significant reduction of costs by moving to the cloud technology." Together with the development of Web mapping services offered by EEA, a much larger user community is served with high-quality, up-to-date environmental data.
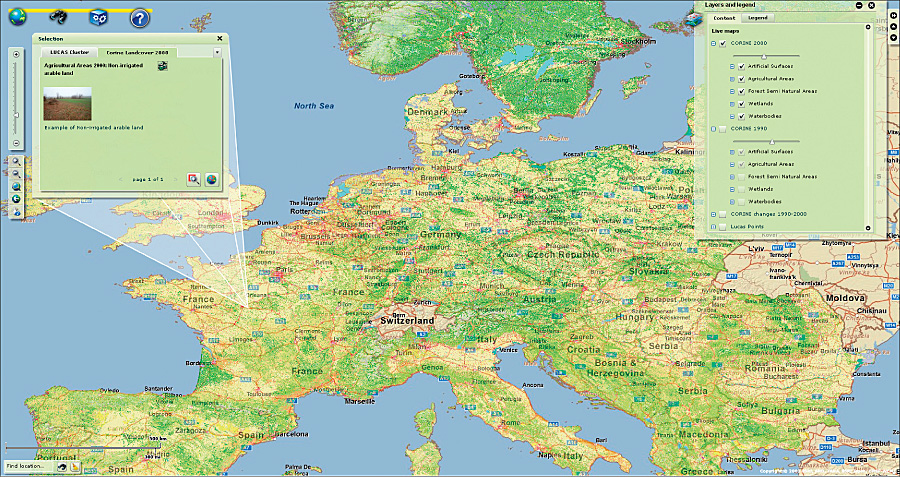
EEA gives access to the CORINE land cover, a European land cover map produced by photointerpretation of Landsat ETM+ images as well as LUCAS (land use/cover area frame survey) to estimate areas that do not coincide with the administrative regions.
The memorandum of understanding supports the design and development of a means for sharing and accessing essential geographic environmental data provided by the agency's 32 member countries and 6 cooperating countries in approximately 450 organizations. During the next year, EEA and Esri will work together to develop
- Cloud architecture that serves EEA initiatives and European Union directives
- Data sharing that is in line with the principles of INSPIRE and SEIS
- Standardized templates and layer definitions that are based on the Esri Community Basemaps initiative
- A collaborative plan that supports the Eye on Earth initiative
"We want our users to be able to access multiple layers, do their own mashups, and create their own applications," explains McGlade. "GIS technology is moving rapidly ahead. In our latest discussions with Esri, we talked about crowdsourcing and mashing possibilities and getting data into the working environment so that people in the field can use GIS for analysis. Esri's providing the way to make this happen."
Source: http://www.esri.com/news/arcnews/fall10articles/european-unions.html
Subscribe to:
Posts (Atom)